Audio Inspector
The Auphonic Audio Inspector is shown on the result page of a finished production and displays details about what our algorithms are changing in audio files. It is possible to zoom and scroll within audio waveforms and the Audio Inspector might be used to manually check production result and input files.
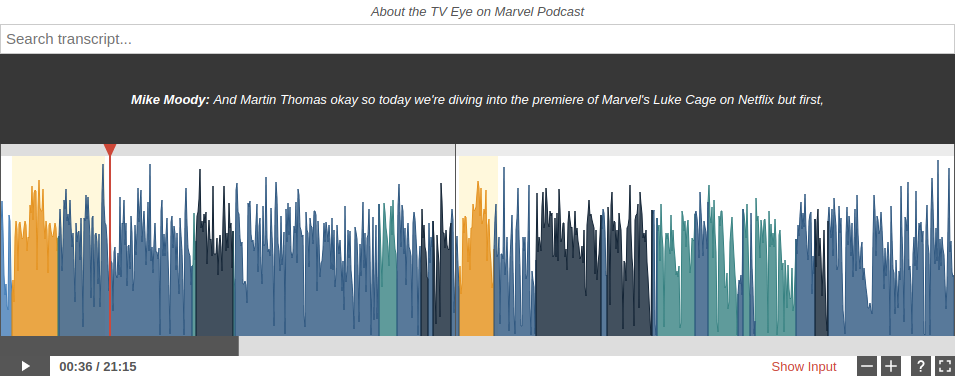
A screenshot of the Auphonic Audio Inspector on the status page of a finished Multitrack Production.
If you just want to try the Auphonic Audio Inspector yourself, take a look at this Multitrack Audio Inspector Example.
Inspector Usage

Control bar of the Audio Inspector with scrollbar, play/pause button,
current playback position and production length,
button to show input audio file(s), zoom in/out, toggle legend and
a button to switch to fullscreen mode.
- Seek in Audio Files
Click or tap inside the waveform to seek in files. The red playhead will show the current audio position.
- Zoom In/Out
Use the zoom buttons ([+] and [-]), the mouse wheel or zoom gestures on touch devices to zoom in/out the audio waveform.
- Scroll Waveforms
If zoomed in, use the scrollbar or drag the audio waveform directly (with your mouse or on touch devices).
- Show Legend
Click the [?] button to show or hide the Legend, which describes details about the visualizations of the audio waveform.
- Show Stats
Use the Show Stats link to display Audio Processing Statistics of a production.
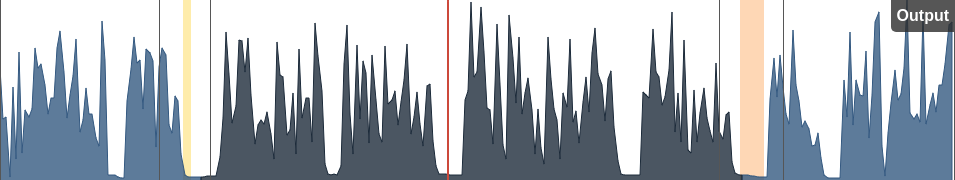
- Show Input Track(s)
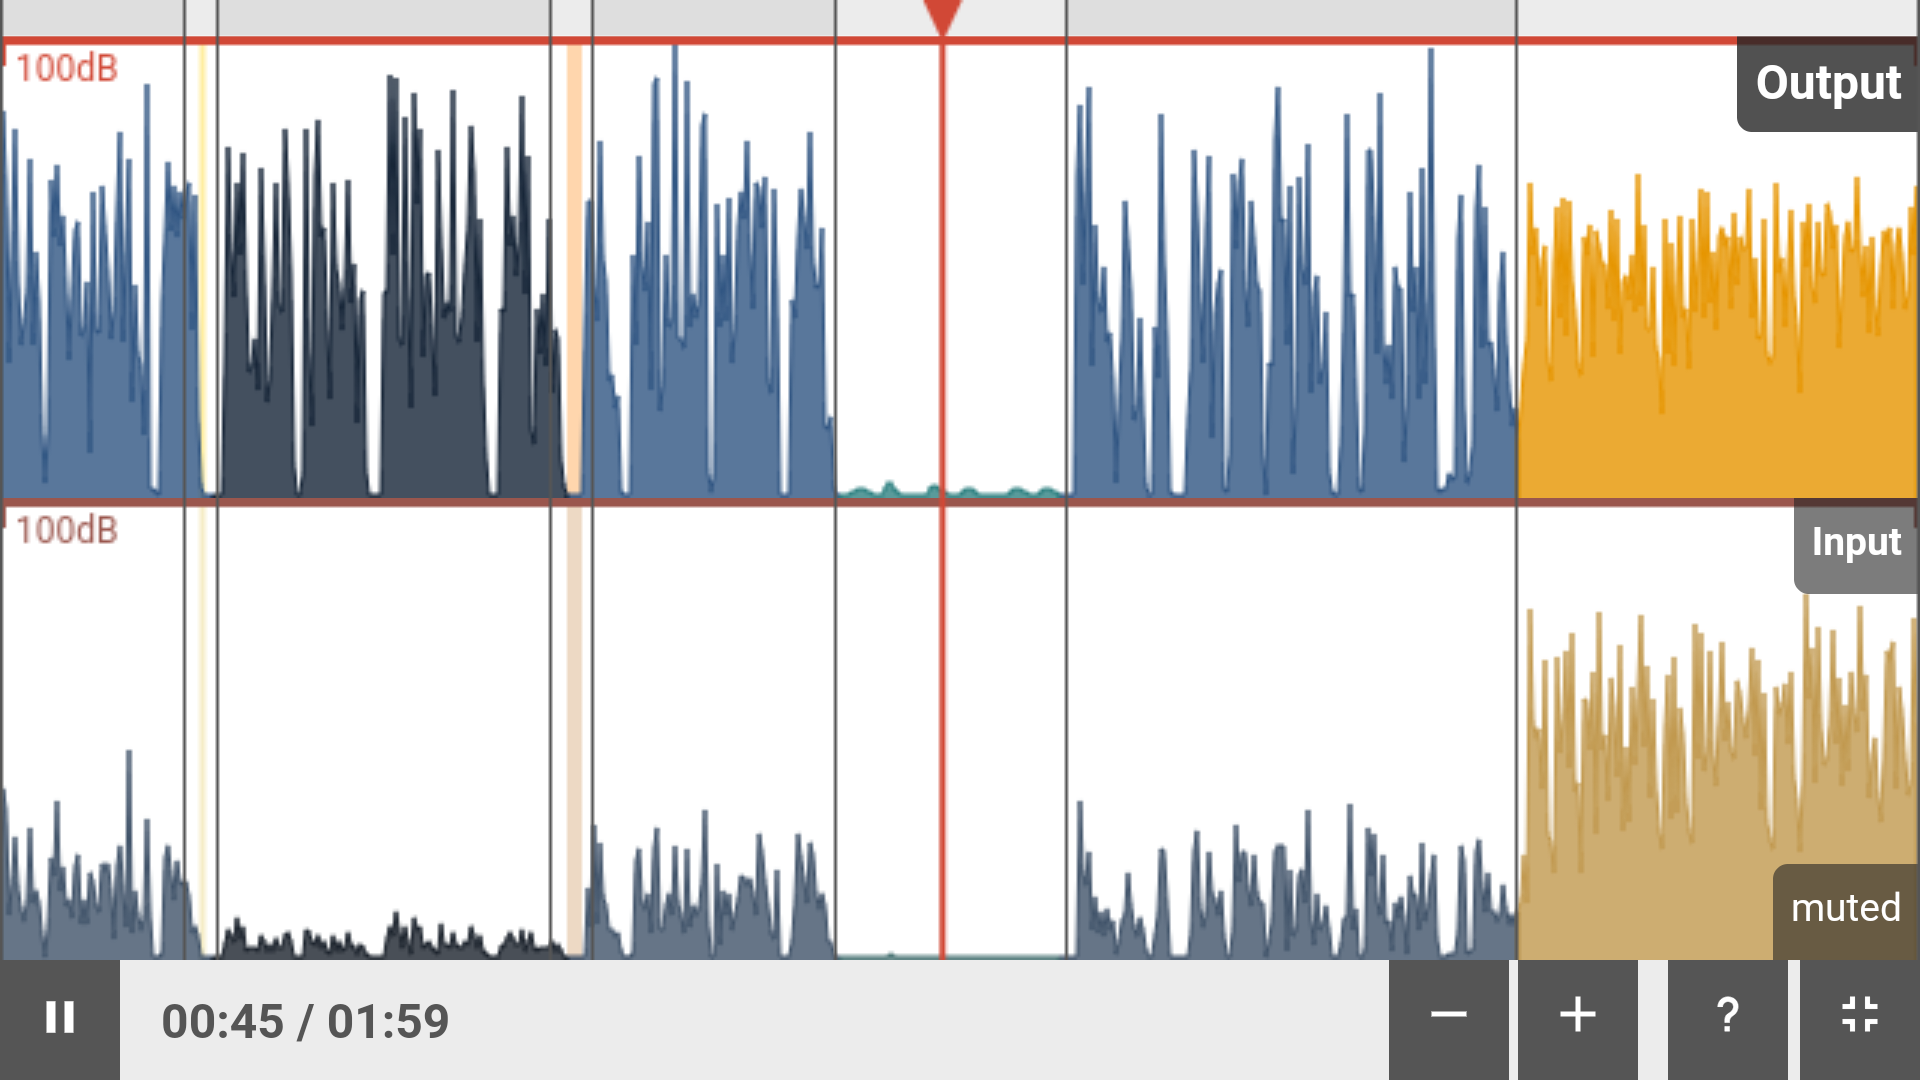
Click Show Input to show or hide input track(s) of a production: now you can see and listen to input and output files for a detailed comparison. Please click directly on the waveform to switch/unmute a track - muted tracks are grayed out slightly:
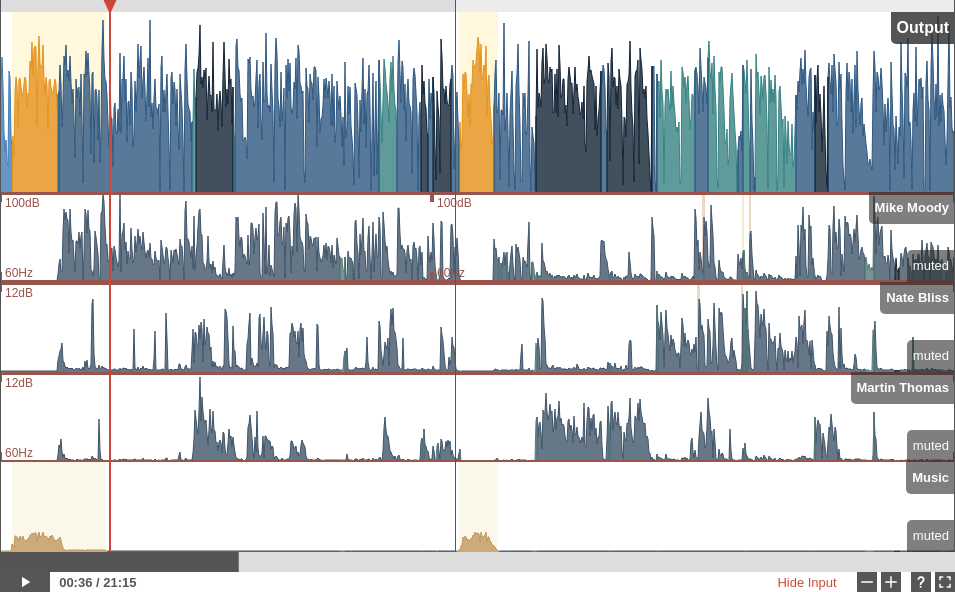
Showing four input tracks and the Auphonic output of a multitrack production.
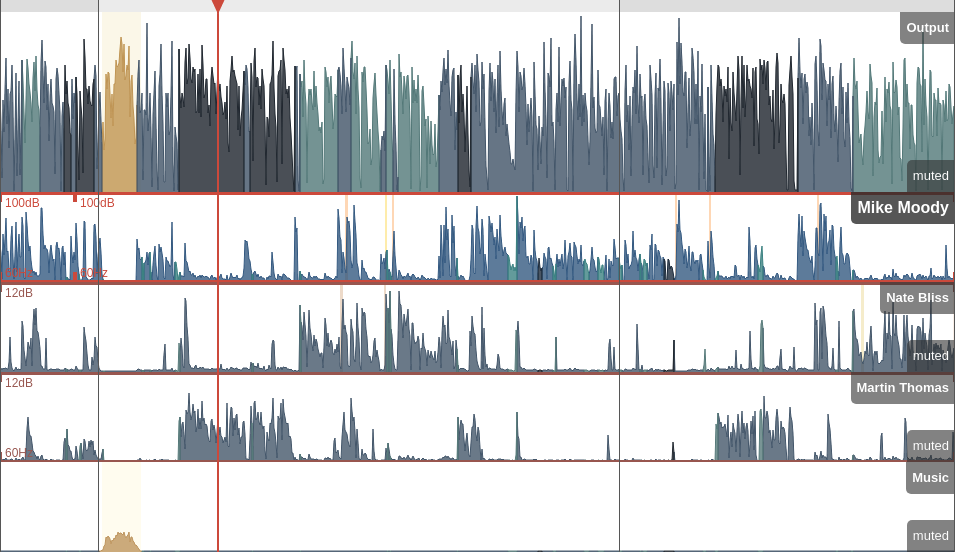
Fullscreen Mode
Please click on the fullscreen button (bottom right) to switch to fullscreen mode.
Now the audio tracks use all available screen space to see all waveform details:
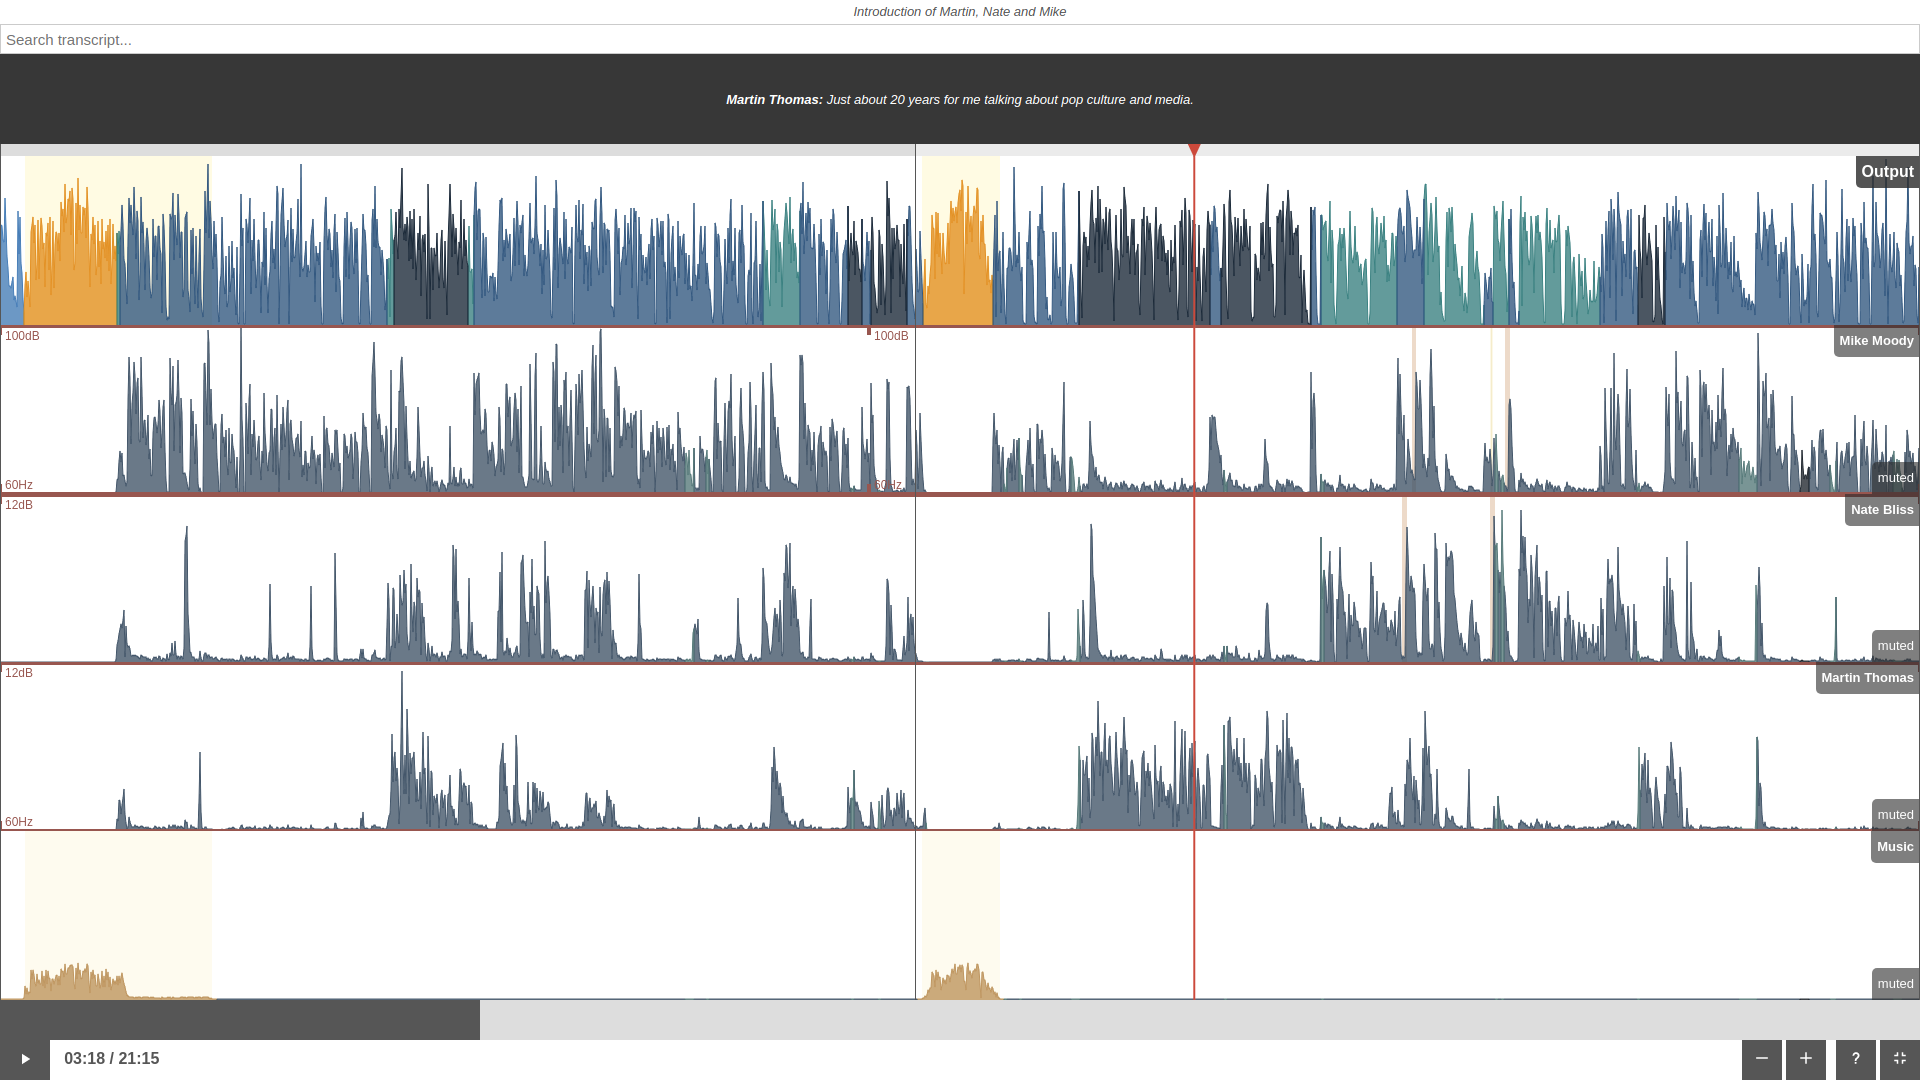
A multitrack production with output and all input tracks in fullscreen mode.
Please click on the screenshot to see it in full resolution.
In fullscreen mode, it’s also possible to control playback and zooming with keyboard shortcuts:
Press [Space] to start/pause playback, use [+] to zoom in and [-] to zoom out.
Singletrack Algorithms Inspector
First, we discuss the analysis data of our Singletrack Post Production Algorithms.
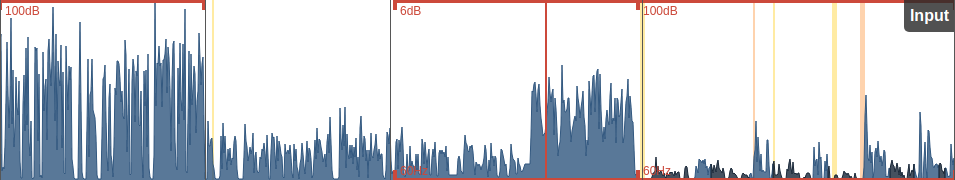
The audio levels of output and input files, measured according to the ITU-R BS.1770 specification, are displayed directly as the audio waveform. Click on Show Input to see the input and output file. Only one file is played at a time, click directly on the Input or Output track to unmute a file for playback:
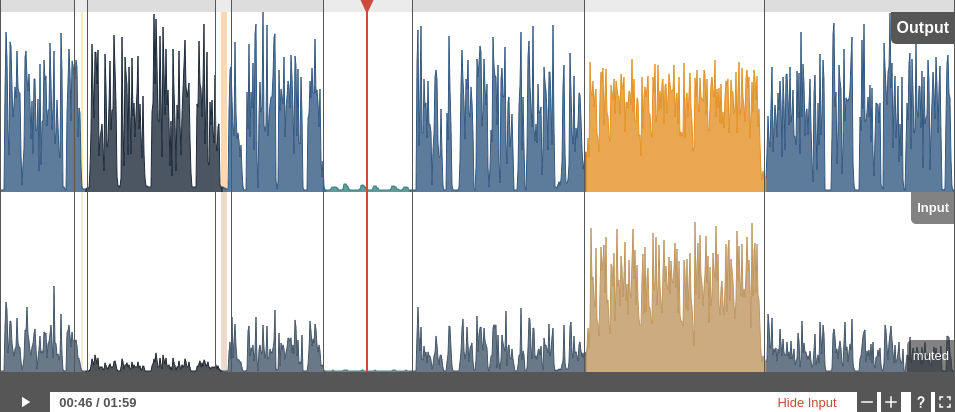
Singletrack Production with opened input file.
See the first Leveler Audio Example to try the audio inspector yourself.
- Waveform Segments: Music and Speech (gold, blue)
Music/Speech segments are displayed directly in the audio waveform: Music segments are plotted in gold/yellow, speech segments in blue (or light/dark blue).
- Waveform Segments: Leveler High/No Amplification (dark, light blue)
Speech segments can be displayed in normal, dark or light blue: Dark blue means that the input signal was very quiet and contains speech, therefore the Adaptive Leveler has to use a high amplification value in this segment.
In light blue regions, the input signal was very quiet as well, but our classifiers decided that the signal should not be amplified (breathing, noise, background sounds, etc.).
Yellow/orange background segments display leveler fades.
- Background Segments: Leveler Fade Up/Down (yellow, orange)
If the volume of an input file changes in a fast way, the Adaptive Leveler volume curve will increase/decrease very fast as well (= fade) and should be placed in speech pauses. Otherwise, if fades are too slow or during active speech, one will hear pumping speech artifacts.
Exact fade regions are plotted as yellow (fade up, volume increase) and orange (fade down, volume decrease) background segments in the audio inspector.
Horizontal red lines display noise and hum reduction profiles.
- Horizontal Lines: Noise and Hum Reduction Profiles (red)
Our Noise and Reverb Reduction and Static Denoiser algorithms segment the audio file in regions with different background noise characteristics, which are displayed as red horizontal lines in the audio inspector (top lines for noise reduction, bottom lines for hum reduction).
Then a noise print is extracted in each region and a classifier decides if and how much noise reduction is necessary - this is plotted as a value in dB below the top red line.
The hum base frequency (50Hz or 60Hz) and the strength of all its partials is also classified in each region, the value in Hz above the bottom red line indicates the base frequency and whether hum reduction is necessary or not (no red line).
You can try the singletrack audio inspector yourself with our Leveler and Noise Reduction audio examples.
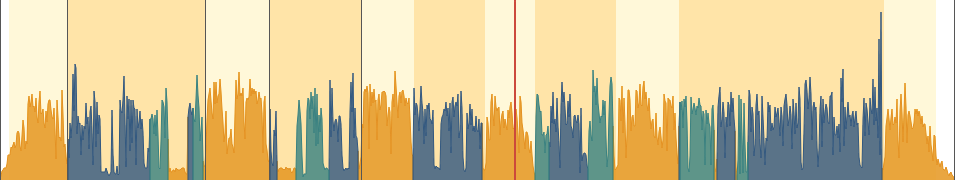
Multitrack Algorithms Inspector
If our Multitrack Post Production Algorithms are used, additional analysis data is shown in the audio inspector.
The audio levels of the output and all input tracks are measured according to the ITU-R BS.1770 specification and are displayed directly as the audio waveform. Click on Show Input to see all the input files with track labels and the output file. Only one file is played at a time, click directly into the track to unmute a file for playback:
- Input Tracks: Waveform Segments, Background Segments and Horizontal Lines
Input tracks are displayed below the output file including their track names. The same data as in our Singletrack Algorithms Inspector is calculated and plotted separately in each input track:
Waveform Segments with different colors: Music and Speech Segments (gold, blue), Leveler High/No Amplification (dark blue, light blue)
Background Segments: Leveler Fade Up/Down (yellow, orange)
Horizontal Lines: Noise and Hum Reduction Profiles Noise and Hum Reduction Profiles (red)
- Output Waveform Segments: Multiple Speakers and Music
Each speaker is plotted in a separate, blue-like color - in the example above we have 3 speakers (normal, light and dark blue) and you can see directly in the waveform when and which speaker is active.
Audio from music input tracks are always plotted in gold/yellow in the output waveform, please try to not mix music and speech parts in music tracks (see also Multitrack Best Practice)!
You can try the multitrack audio inspector yourself with our Multitrack Audio Inspector Example or our general Multitrack Audio Examples.
Ducking, Background and Foreground Segments
Music tracks can be set to Ducking, Foreground, Background or Auto - for more details please see Automatic Ducking, Foreground and Background Tracks.
- Ducking Segments (light, dark orange)
In Ducking, the level of a music track is reduced if one of the speakers is active, which is plotted as a dark orange background segment in the output track.
Foreground music parts, where no speaker is active and the music track volume is not reduced, are displayed as light orange background segments in the output track.
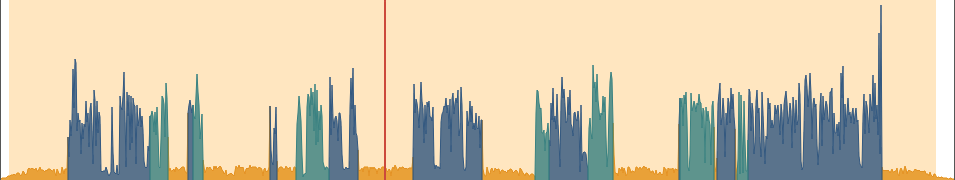
- Background Music Segments (dark orange background)
Here the whole music track is set to Background and won’t be amplified when speakers are inactive.
Background music parts are plotted as dark organge background segments in the output track.
- Foreground Music Segments (light orange background)
Here the whole music track is set to Foreground and its level won’t be reduced when speakers are active.
Foreground music parts are plotted as light organge background segments in the output track.
You can try the ducking/background/foreground audio inspector yourself: Fore/Background/Ducking Audio Examples.
Audio Processing Statistics
The audio processing statistics show analysis details about input and output audio files.
Click on Show Stats in the Control Bar to display tables with statistics:
Singletrack Audio Processing Statistics
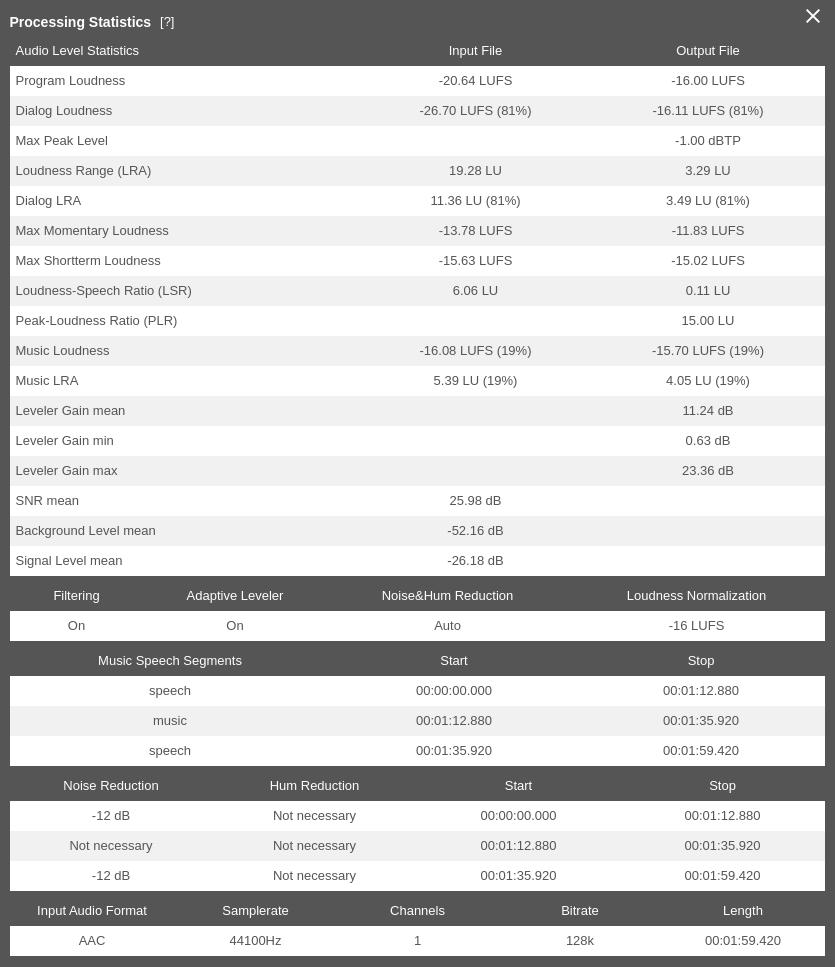
Auphonic processing statistics of a Singletrack Production.
- Audio Level Statistics Table
This table lists information about the loudness and levels of input and output audio files.
These statistics can be used to check compliance with Loudness Standards (Programme Loudness, Maximum True Peak Level, Loudness Range / LRA - see Loudness Measurement and Normalization) and certain regulations for commercials (Max Momentary Loudness, 400ms integration time; Max Short-term Loudness, 3sec integration time - see EBU TECH 3341, Section 2.2).
The table also provides loudness statistics for dialog and music parts (Dialog Loudness, Dialog LRA, Music Loudness, Music LRA and Loudness-to-Speech Ratio / LSR - see Dialog Loudness Normalization for Cinematic Content).
Furthermore, it shows how much our Adaptive Leveler changes levels (Leveler Gain mean, min, max) and lists statistics about input audio signals (Signal-to-Noise Ratio/SNR, Background Level, Signal Level).- Music Speech Segments Table
Lists music and speech segments of a production. Very short speech/music segments are not displayed.
- Noise and Hum Reduction Table
Lists how much Noise Reduction and/or Hum Reduction was used in which segments of the output audio file.
- Input Audio Format Table
Shows details about the input audio format (Format, Samplerate, Channels, Bitrate, Length).
Multitrack Audio Processing Statistics
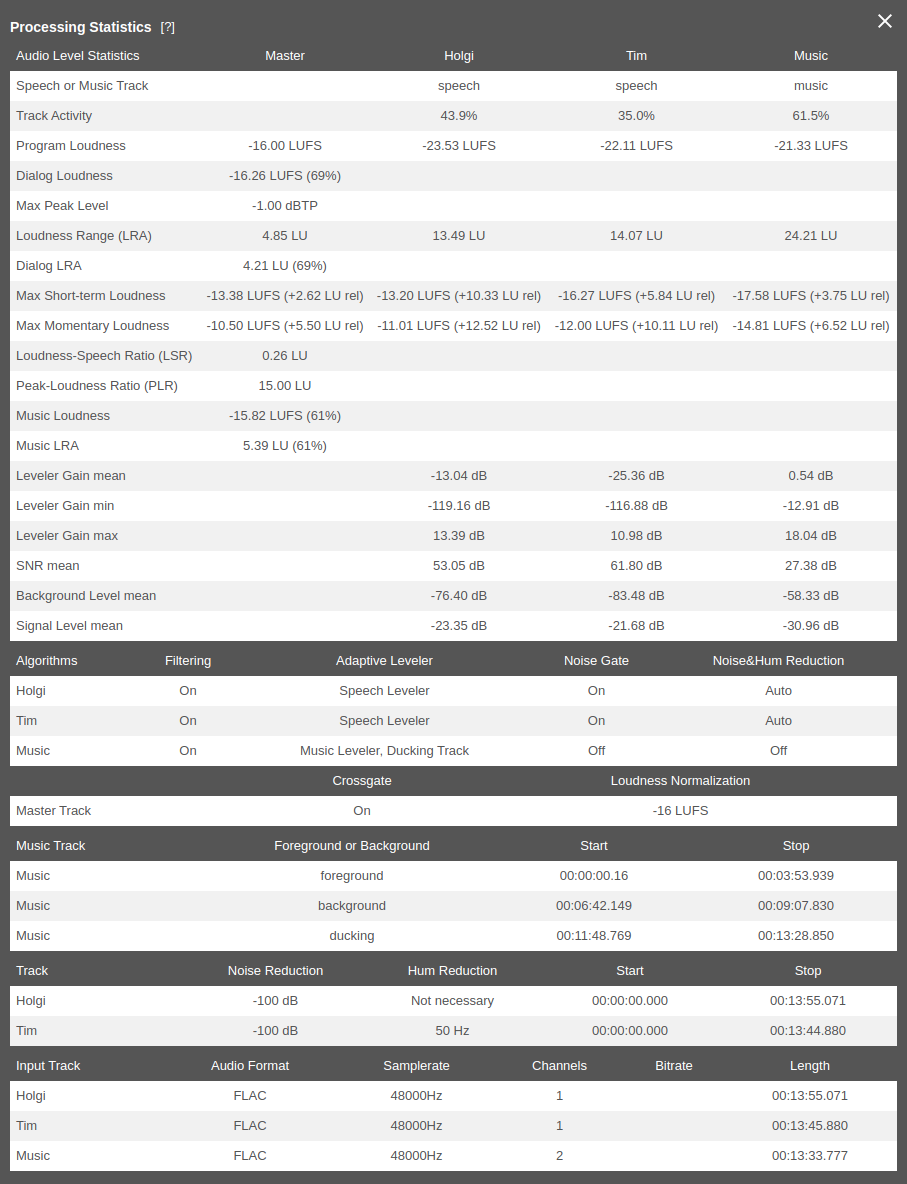
Auphonic processing statistics of a Multitrack Production.
- Audio Level Statistics Table
Lists information about the loudness and levels of all input files/tracks (Holgi, Tim and Music in the screenshot above) and the output audio file (Master). Values per track are the same as in our Singletrack Audio Processing Statistics.
Additionally, it shows if a track was classified as music or speech (Speech or Music Track) and the activity in percent of each speaker/track.- Music Track Segments Table
Lists active segments in each music track. Each segment can be in foreground, background or ducking - please see Automatic Ducking, Foreground and Background Tracks.
- Noise and Hum Reduction Table
Lists how much Noise and/or Hum Reduction was used in which segments of each track.
- Input Track Audio Format Table
Shows details about input audio files/tracks (Format, Samplerate, Channels, Bitrate, Length).
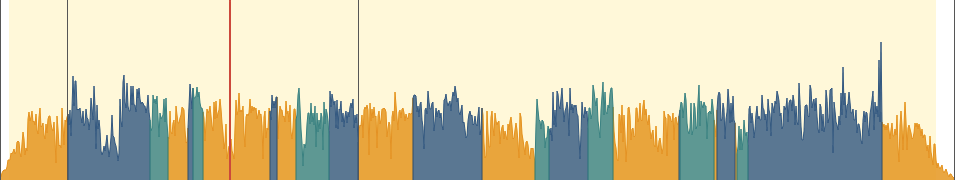
Audio Search, Chapters Marks and Videos
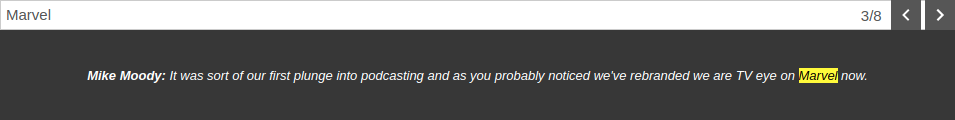
- Audio Search and Transcriptions
If our Automatic Speech Recognition Integration is used, a time-aligned transcription text will be shown above the waveform. You can use the search field to search and seek directly in the audio file.
See our Speech Recognition Audio Examples to try it yourself.
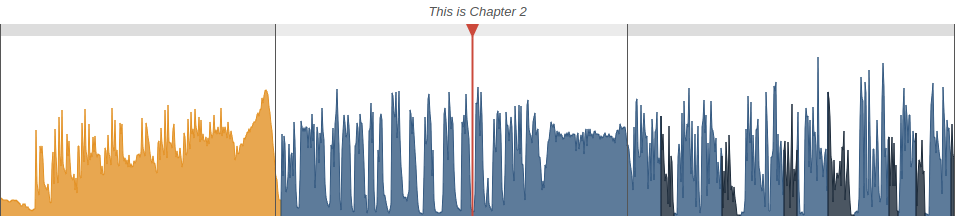
- Chapters Marks
Chapter Mark start times are displayed in the audio waveform as black vertical lines.
The current chapter title is written above the waveform - see “This is Chapter 2” in the screenshot above.
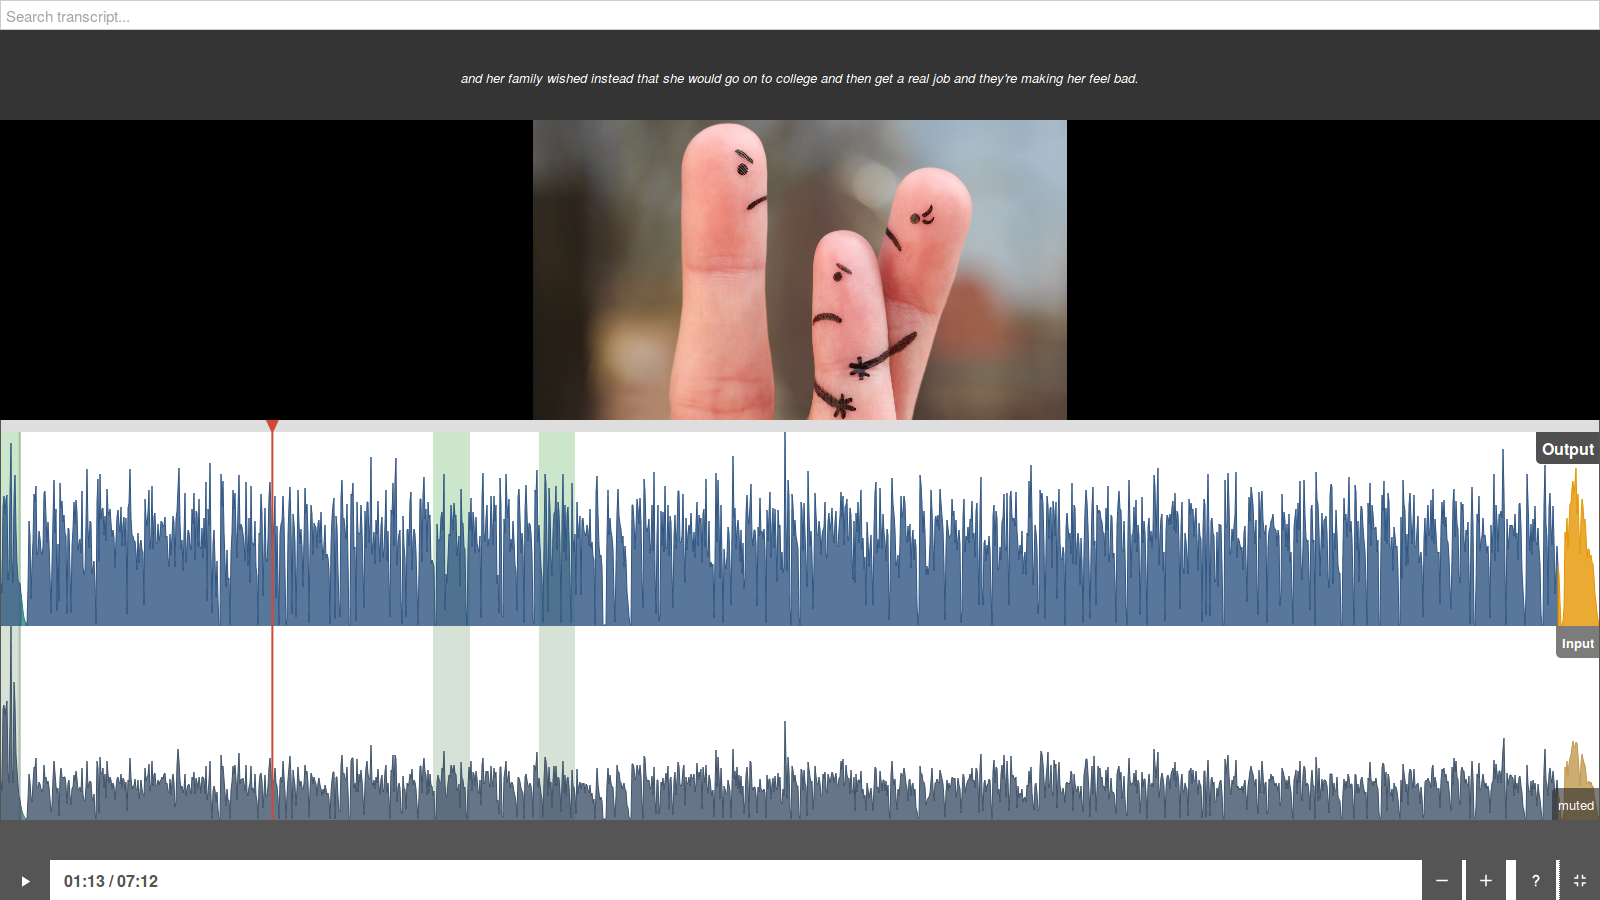
A video production with output waveform, input waveform and transcriptions in fullscreen mode.
Please click on the screenshot to see it in full resolution.
- Video Display
If you add a Video Format or Audiogram Output File to your production, the audio inspector will also show a separate video track in addition to the audio output and input tracks. The video playback will be synced to the audio of output and input tracks.
Supported Audio Formats
We use the native HTML5 audio element for playback and the aurora.js javascript audio decoders to support all common audio formats:
- WAV, MP3, AAC/M4A and Opus
These formats are supported in all major browsers: Firefox, Chrome, Safari, Edge, iOS Safari and Chrome for Android.
- FLAC
FLAC is supported in Firefox, Chrome, Edge and Chrome for Android - see FLAC audio format.
In Safari and iOS Safari, we use aurora.js to directly decode FLAC files in javascript, which works but uses much more CPU compared to native decoding!- ALAC
ALAC is not supported by any browser so far, therefore we use aurora.js to directly decode ALAC files in javascript. This works but uses much more CPU compared to native decoding!
- Ogg Vorbis
Only supported by Firefox, Chrome and Chrome for Android - for details please see Ogg Vorbis audio format.
We suggest to use a recent Firefox or Chrome browser for best performance.
Decoding FLAC and ALAC files also works in Safari and iOS with the help of aurora.js,
but javascript decoders need a lot of CPU and they sometimes have problems with
exact scrolling and seeking.
Please see our blog post Audio File Formats and Bitrates for Podcasts for more details about audio formats.
Mobile Audio Inspector
Multiple responsive layouts were created to optimize the screen space usage on Android and iOS devices, so that the audio inspector is fully usable on mobile devices as well: tap into the waveform to set the playhead location, scroll horizontally to scroll waveforms, scroll vertically to scroll between tracks, use zoom gestures to zoom in/out, etc.
Unfortunately the fullscreen mode is not available on iOS devices (thanks to Apple), but it works on Android and is a really great way to inspect everything using all the available screen space:
Audio inspector in horizontal fullscreen mode on Android.